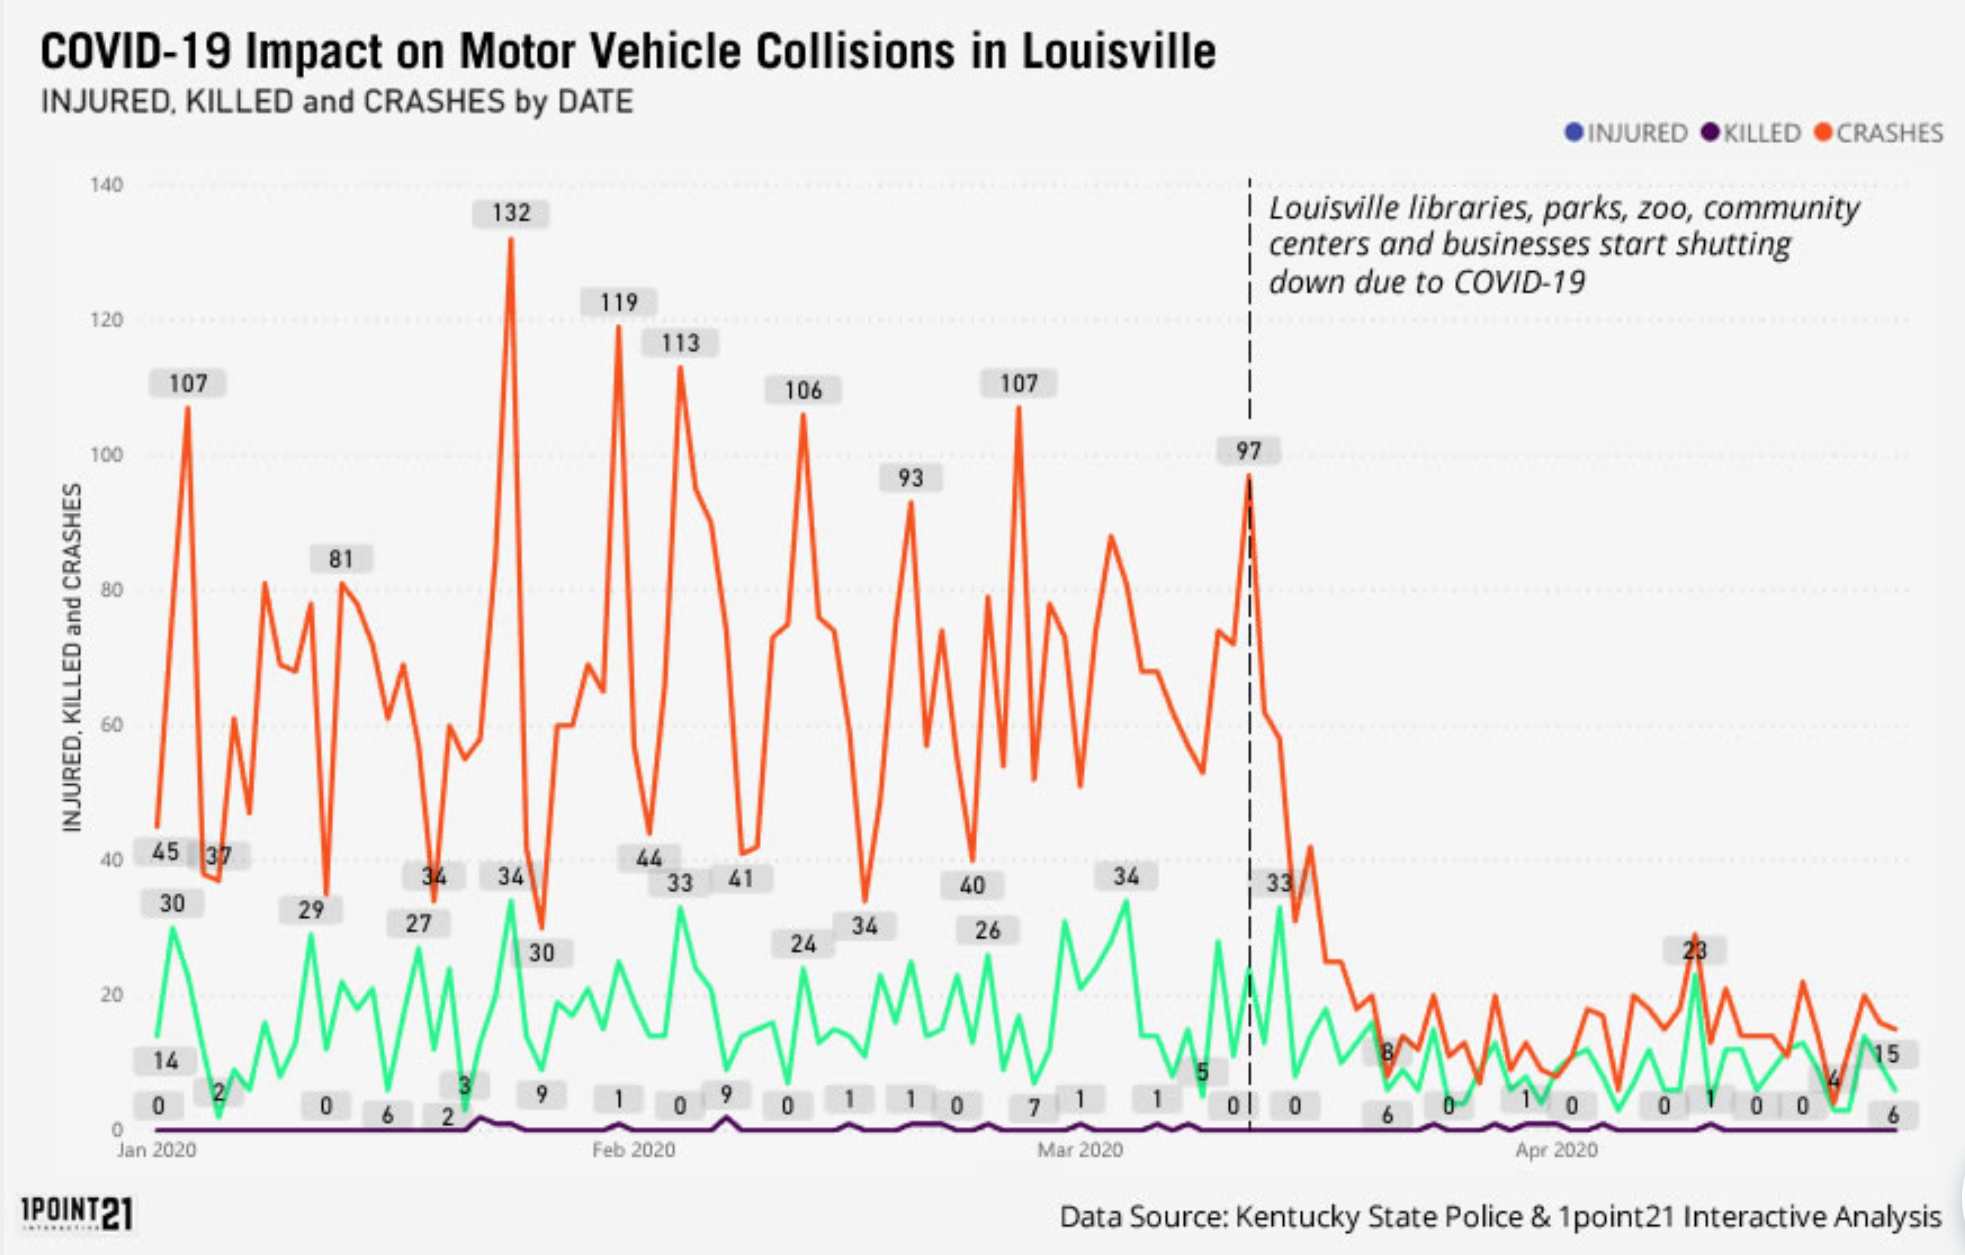
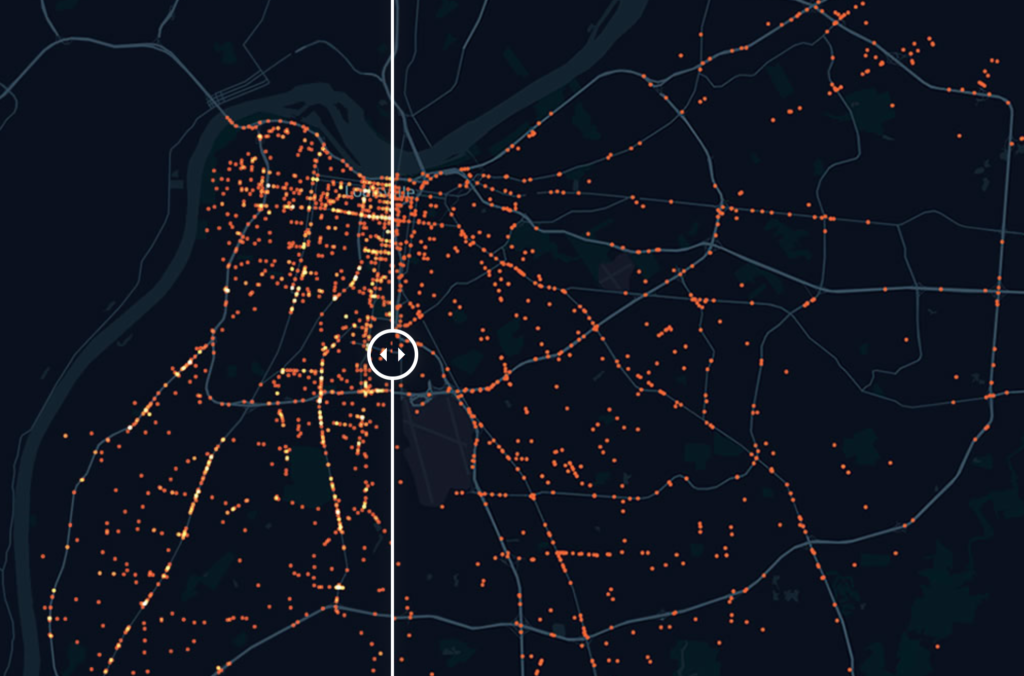
As everyone is aware, with less cars on the road due to Corona Virus, there is less car accidents. The Law Firm of Meinhart Smith & Manning just launched a very cool data visualization that puts this fact in stark relief. One of the more interesting features is an interactive heat map slider that shows the difference in accidents from 2019 to 2020 in Louisville Kentucky. This is a screenshot, but on their website you can move the slider from right to left.
Stay safe everyone!

